%%{init: {'theme':'forest'}}%%

graph LR;
        subgraph Sensor-level-analysis

       A[Decode time-by-time </br>  using a 'sliding' estimator] --> B[Time-frequency </br> decomposition]
       B --> C[Decoding </br> based on </br> common spatial patterns]
       C --> D[Noise covariance </br> estimation]
       D --> E[Group average </br> at the </br> sensor level]
   end

    subgraph Preprocessing

       l1[Assess </br> channel-wise </br> data quality] --> l2[Estimate </br> head positions]
       l2 --> l3[Apply low- and </br> high-pass filters]
       l3 --> l4[Temporal regression </br> for artifact removal]
       l4 --> l5a[Fit ICA]
       l5a --> l6a[Find ICA </br> artifacts]
       l4 --> l5b[Extract epochs]
       l5b --> l7[Apply ICA]
       l6a --> l7 --> l8[Remove epochs </br> based on  </br> PTP amplitudes]
       l5b --> l6b[Apply SSP]
       l4 --> l5c[Compute SSP]
       l5c --> l6b[Apply SSP]
       l6b --> l8[Remove epochs </br> based on </br> PTP amplitudes]
       l8 --> l9[Extract </br> evoked data for </br> each condition]
       l9 --> l10[Decode pairs of </br>  conditions based on </br> entire epochs]
    end


   %%l0[Raw Data] --> l1
   %%E --> F[Output </br> Statistical </br> Analysis Pipeline]

   classDef green fill:#9f6,stroke:#333,stroke-width:0.5px;
   classDef orange fill:#f96,stroke:#333,stroke-width:1px;
   classDef white fill:#fff,stroke:#333,stroke-width:1px;
   classDef sq stroke:#f66,stroke-width:1px;
   classDef blue fill:#6699cc,stroke:#333,stroke-width:1px;
   classDef red fill:#D32737,stroke:#FFF,stroke-width:1.5px;

   class Preprocessing,Sensor-level-analysis white
Misophonia Project
Overview
What is misophonia?
Also, known as selective sound sensitivity syndrome or sound-rage, misophonia is a disorder in which certain sounds trigger emotional or physiological responses that some might perceive as unreasonable given the circumstance. Those who have misophonia might describe it as when a sound “drives you crazy.” Their reactions can range from anger and annoyance to panic and the need to flee.
Ward, R. T., Gilbert, F. E., Pouliot, J., Chiasson, P., McIlvanie, S., Traiser, C., … & Keil, A. (2022). The Relationship Between Self-Reported Misophonia Symptoms and Auditory Aversive Generalization Leaning: A Preliminary Report. Frontiers in Neuroscience, 16, 899476. https://doi.org/10.3389/fnins.2022.899476
Farkas, A. H., Ward, R. T., Gilbert, F. E., Pouliot, J., Chiasson, P., McIlvanie, S., … & Keil, A. (2023). Auditory Aversive Generalization Learning Prompts Threat-Specific Changes in Alpha-Band Activity. bioRxiv, 2023-12. https://doi.org/10.1101/2023.12.04.569971
Accepted Pre-registration: Ward, R., Keil, A., Pouliot, J., Mears, R. P., Chiasson, P., & McIlvanie, S. (2021, September 27). Psychophysiological mechanisms underlying aversive conditioning in Misophonia.https://doi.org/10.17605/OSF.IO/E26AD
Auditory Steady-State Response
Brugge, J. F., Nourski, K. V., Oya, H., Reale, R. A., Kawasaki, H., Steinschneider, M., & Howard III, M. A. (2009). Coding of repetitive transients by auditory cortex on Heschl’s gyrus. Journal of neurophysiology, 102(4), 2358-2374. https://doi.org/10.1152/jn.91346.2008
Popov, T., Oostenveld, R., & Schoffelen, J. M. (2018). FieldTrip made easy: an analysis protocol for group analysis of the auditory steady state brain response in time, frequency, and space. Frontiers in neuroscience, 12, 711.https://doi.org/10.3389/fnins.2018.00711
Pantev, C., Roberts, L. E., Elbert, T., Roβ, B., & Wienbruch, C. (1996). Tonotopic organization of the sources of human auditory steady-state responses. Hearing research, 101(1-2), 62-74.
Parker, D. A., Hamm, J. P., McDowell, J. E., Keedy, S. K., Gershon, E. S., Ivleva, E. I., … & Clementz, B. A. (2019). Auditory steady-state EEG response across the schizo-bipolar spectrum. Schizophrenia research, 209, 218-226. https://doi.org/10.1016/j.schres.2019.04.014
MNE-Python Workflow (Schematic)
MNE-Python
- MNE-Python is a Python package for MEG and EEG data analysis.
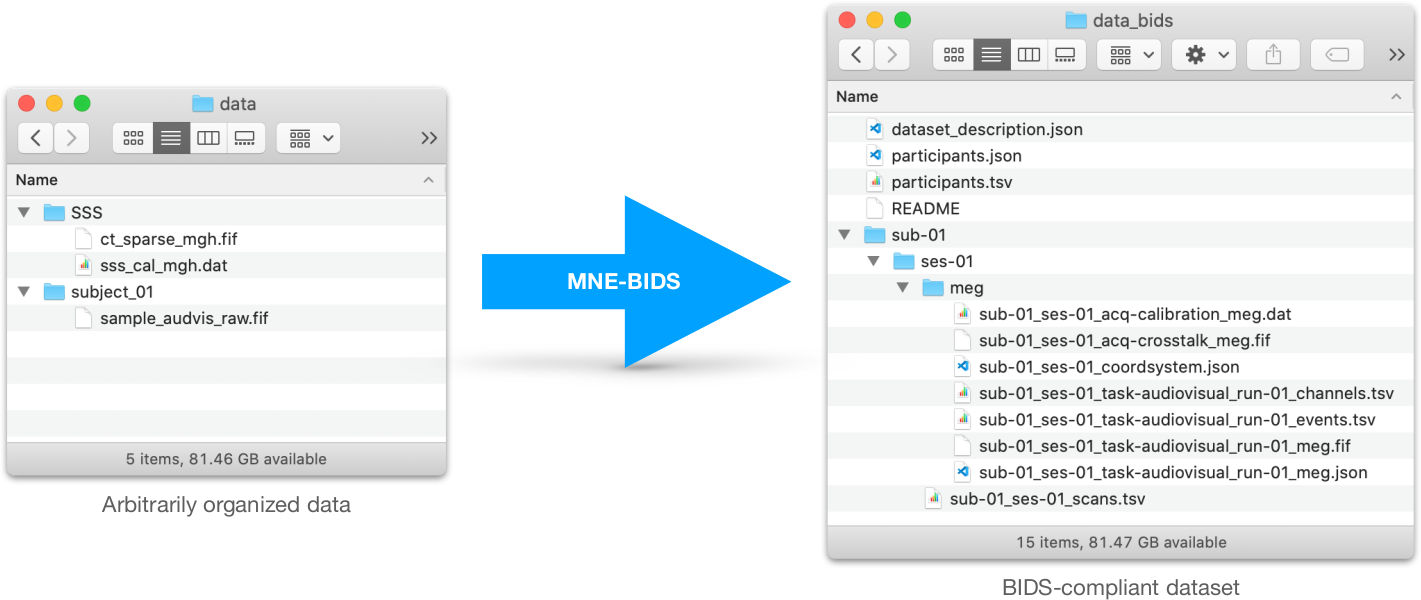
MNE-BIDS
MNE-BIDS-Pipeline
- MNE-BIDS-Pipeline is a full-flegded processing pipeline Python package for preprocessing MEG and EEG data.
Prepare your dataset
MNE-BIDS-Pipeline only works with BIDS-formatted raw data.
Create a configuration file
All parameters of the pipeline are controlled via a configuration file. Create a template:
mne_bids_pipeline --create-config=/path/to/custom_config.py
import numpy as np

study_name = "ds000247"
bids_root = f"~/mne_data/{study_name}"
deriv_root = f"~/mne_data/derivatives/mne-bids-pipeline/{study_name}"

subjects = ["0002"]
sessions = ["01"]
task = "rest"
task_is_rest = True

crop_runs = (0, 100)  # to speed up computations

ch_types = ["meg"]
spatial_filter = "ssp"

l_freq = 1.0
h_freq = 40.0

rest_epochs_duration = 10
rest_epochs_overlap = 0

epochs_tmin = 0
baseline = NoneRun the pipeline
A config file controls main pipeline parameters. CLI runs all (or part with an override).
- Re-running a specific stage of the pipeline for additional data
mne_bids_pipeline --config=custom_config.py --steps=preprocessing --subjects=0051,0052,0053
- Running the pipeline with different parameters for a specific stage (e.g., changing filter cutoffs, interpolating bad channels, etc.)
mne_bids_pipeline --config=custom_config.py --steps=preprocessing/ica
- Running the pipeline with different parameters for a specific subject or session
mne_bids_pipeline --config=custom_config.py --steps=preprocessing/ica --session=cond --subjects=0051,0052,0053
Visualize the results (HTML reports)
BIDS projects are located two places:
- Miso Project
/blue/psb4934/share/misophonia/bids_eegThe
derivativesfolder contains the results of the pipeline, including the HTML reports. The overall structure of thederivativesfolder is as follows:Original BIDS-format data are in a different location than reports.
The original BIDS data for subject
sub-M603is located in a subfolder named/sub-M603/eeg/in the main BIDS folder.- the report for subject
sub-M603is located in a subfolder named/derivatives/mne-bids-pipeline/sub-M603/eeg/in thederivativesfolder.
- the report for subject
the report for the group-level analysis (i.e., including grand averages) located in a subfolder named
/derivatives/mne-bids-pipeline/sub-average/eeg/in thederivativesfolder.. ├── dataset_description.json ├── derivatives │ └── mne-bids-pipeline │ ├── sub-average │ │ └── eeg │ │ └── sub-average_task-genaudi3_report.html │ ├── sub-M603 │ │ └── eeg │ ├── sub-M604 │ │ └── eeg │ . │ : │ ├── sub-M603 │ ├── eeg │ └── sub-M603_scans.tsv ├── sub-M604 │ ├── eeg │ └── sub-M604_scans.tsv │ . :- So, to find the grand aveage report, you need to go to
/blue/psb4934/share/misophonia/bids_eeg/derivatives/mne-bids-pipeline/sub-average/eegand look for thesub-average_task-genaudi3_report.htmlfile. (For convenience, the grand average report is copied to/blue/psb4934/share/misophonia/MNE-BIDS_reports/subaverage)
- So, to find the grand aveage report, you need to go to
- SZ/BP BIDS data:
/blue/psb4934/share/mears/assr_data/bids_assr- The BIDS paths are similar for this dataset as well. The reports are located in the
derivativesfolder. The grand average report is located in thesub-averagefolder.
- The BIDS paths are similar for this dataset as well. The reports are located in the
Finding things on HiPerGator
Correct address for python env :
exec /blue/psb4934/share/conda/envs/mne_1_6_0/mne/bin/python -m ipykernel "$@"